
1. Search for (alternative) polyadenylations (PAs) for a gene of interest.
2. Browse the catalog of genes available in APADB.
3. Go to the genome browser of a specific organism to visualize MACE reads supporting PA events.
4. Download the database in BED format for human, mouse or chicken.
Sections
How to get information about polyadenylation sites for a gene of interest (GOI)
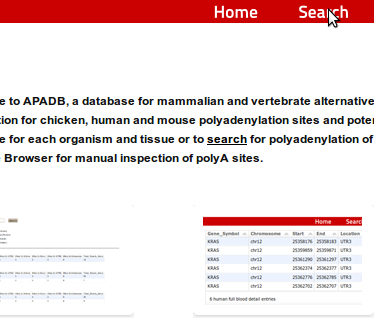 1. From the start site select the Search button on top of the page
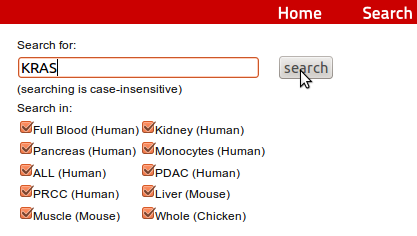 2. On the next page enter the HUGO name of your GOI and klick on Search
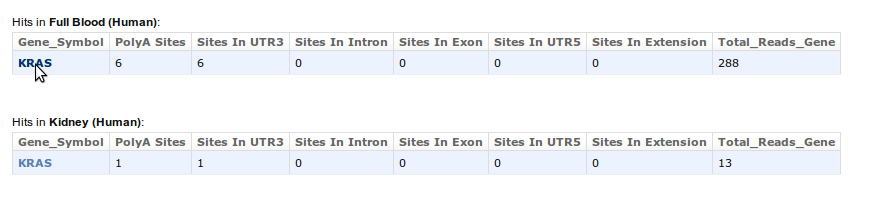
3. On the following screen you get information about the number of PA sites for the gene in each organism for each tissue. In addition, the locations of these PA sites are shown together with the total number of reads supporting all sites. For detailed information, like genomic positions of the PA site, the user can click on the HUGO name of the gene. For more information see 4.
4. In the detailed view information about the genomic PA site position, region of the corresponding gene, median and mode of the cluster as well as reads supporting the PA site are given. If miRNA binding sites predicted by TargetScan/miRanda are lost in the case of usage of the respective PA site, the names of these miRNAs are available via the View link (see 5.).
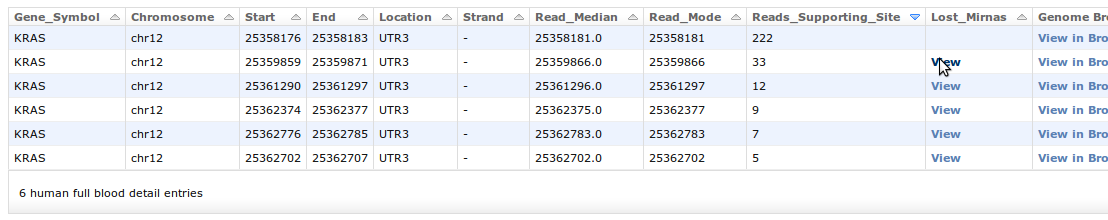
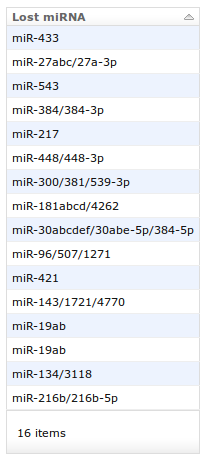 5. The miRNA binding sites lost by using the respective PA site are listed in a new window.
6. To visualize NGS reads supporting a specific PA site, the user can choose View in browser from the screen described in 4. How to use the browser is explained in the next section.
Back to top
How to use the genome browser
The APADB genome browser offers the possibility to visualize mapped MACE NGS reads together with several BED track files for mouse (mm10), human (hg19) as well as chicken (galgal4).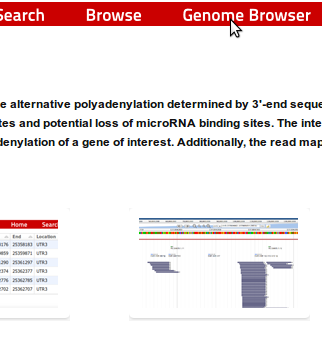 7. The browser can either be reached as described in 4./6. or by the Genome Browser link available at the start site.
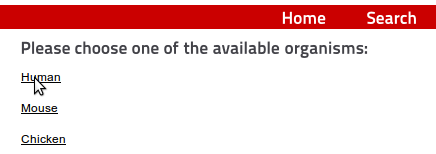 8. Coming from the start site the organism can be chosen
9. To get to a specific genomic position, either the gene name or a chromosomal location can be entered
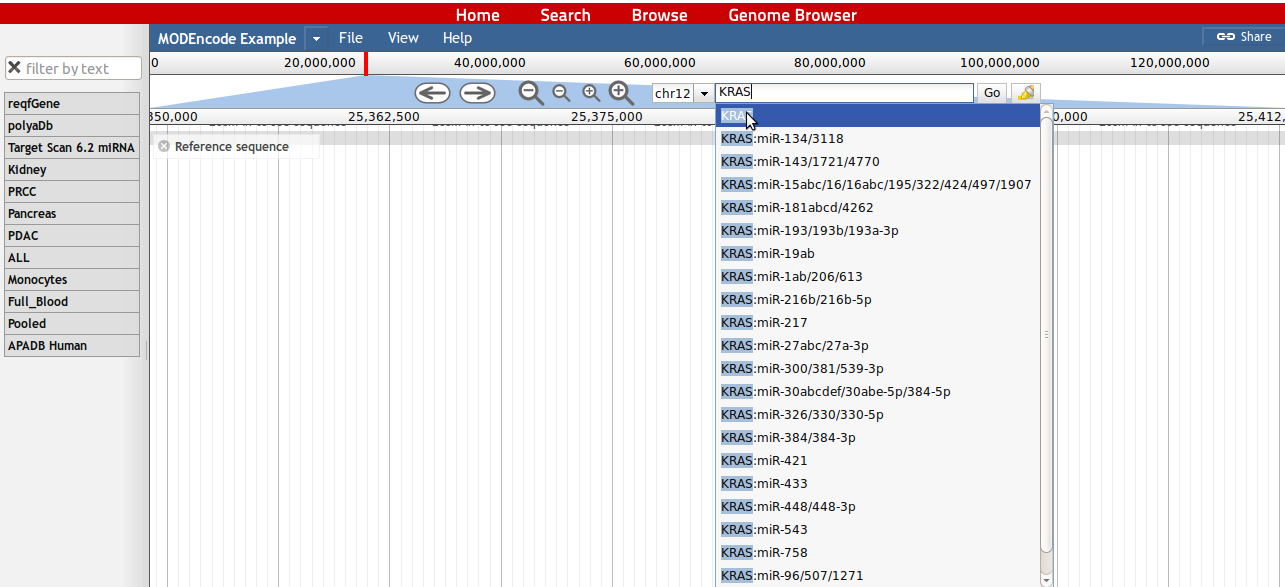
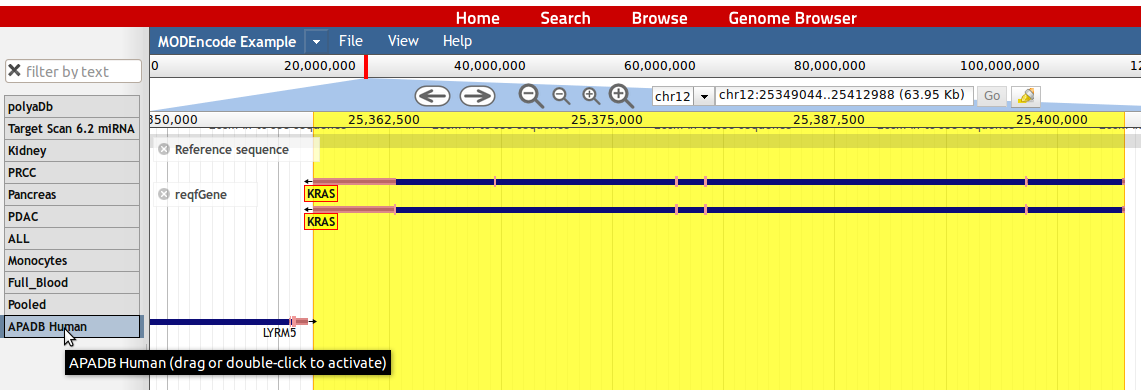
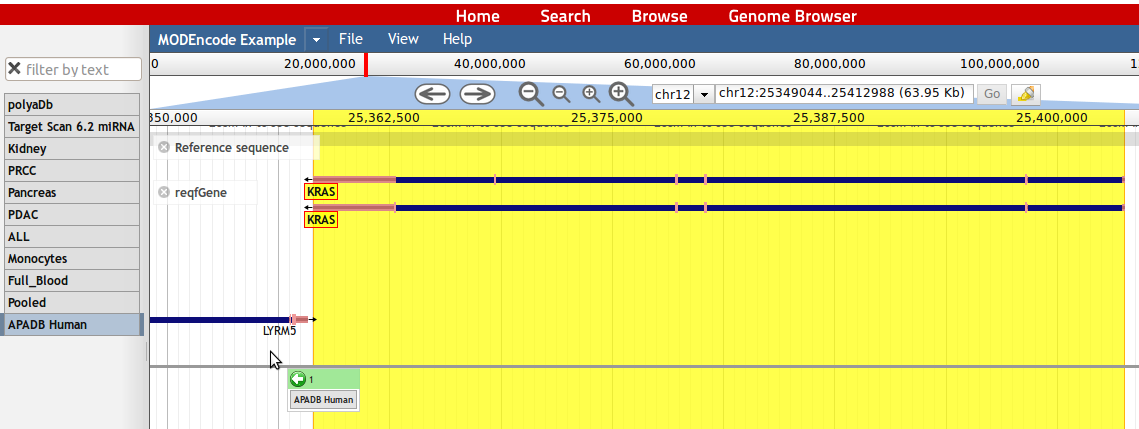
10. All tracks available for the browser are available at the right side. To visualize information from a track, the user can drag it into the browser or double click on the track name.
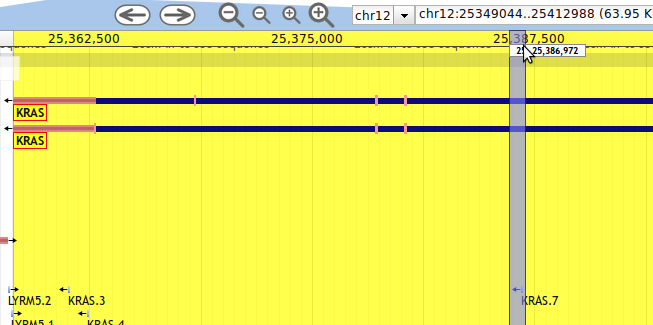
11. To zoom into a genomic location, a zoom function can be accessed by holding the left mouse button and choosing the genomic region of interest. Alternatively the user can click on the large '+' button to zoom in deeply or on the small '+' button to zoom in slightly.
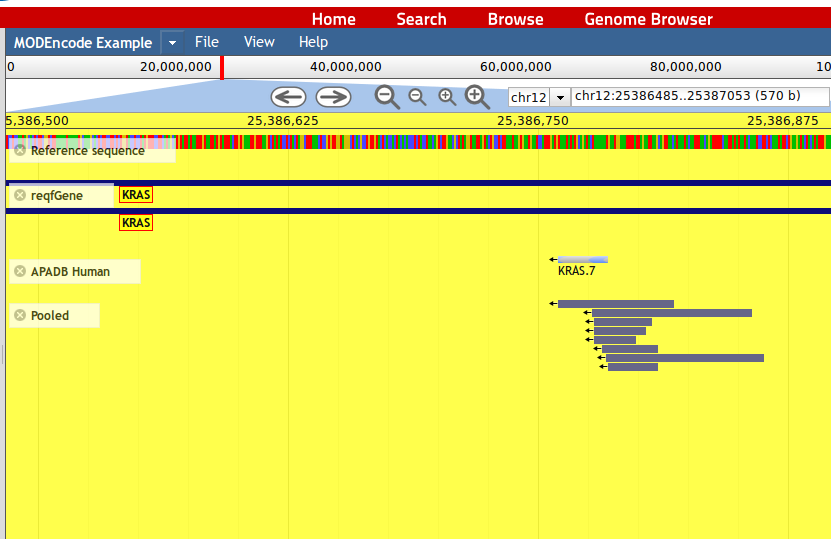
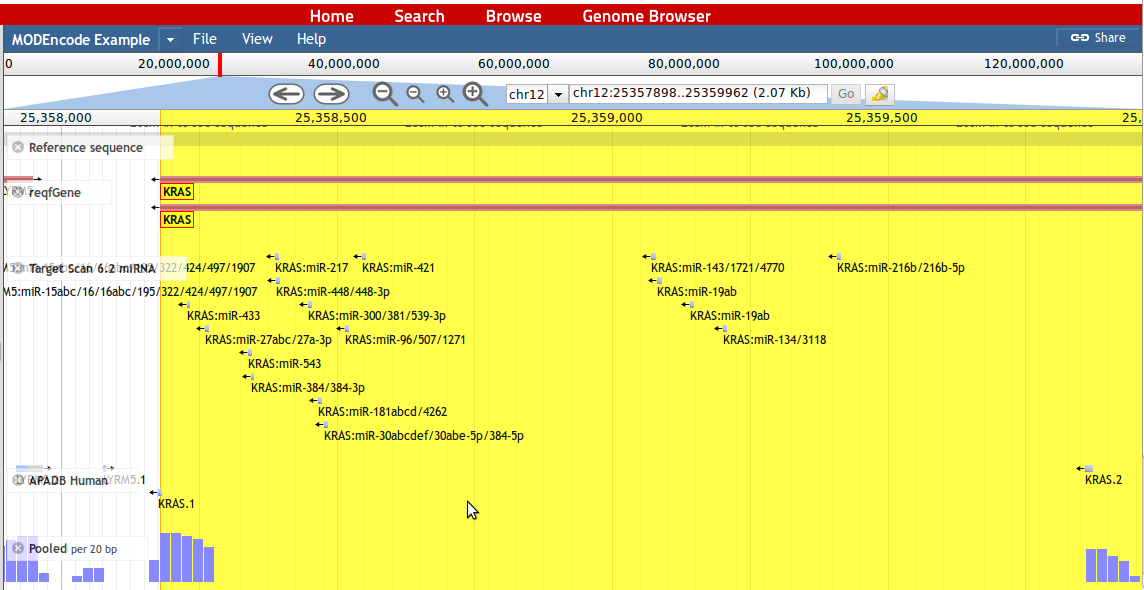
12. If the user has chosen a MACE read alignment track, like the 'Pooled' human track, which contains the pooled reads from all human tissues, and in addition the APADB track, the read alignment leading to an entry in APADB can be inspected. Here the 7th PA site of KRAS is displayed. The end of the MACE reads (arrows after dark blue stretches) represent the PA site of a KRAS RNA molecule, that wobble by a few base pairs. Therefore, the PA as given in APADB (light blue) is 25 base pairs long.
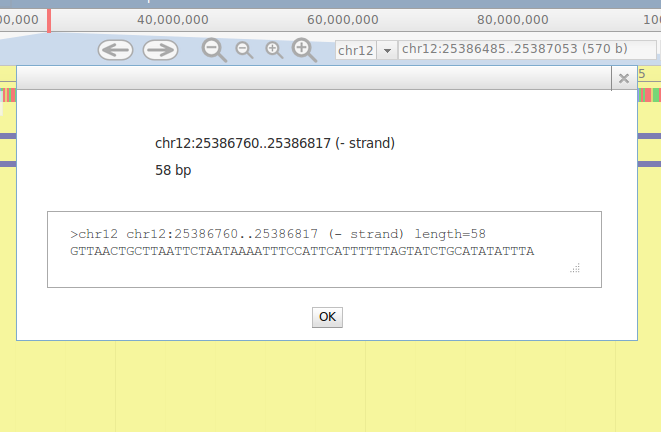 13. By clicking on a read, the sequence and mapping information is being displayed. This is possible for each feature in the browser.
14. Lost miRNA binding sites are contained in the 'Target Scan 6.2 miRNA' track an help the user to identify miRNA binding sites lost when specific PA sites are used.
Back to top
How to browse the APADB database
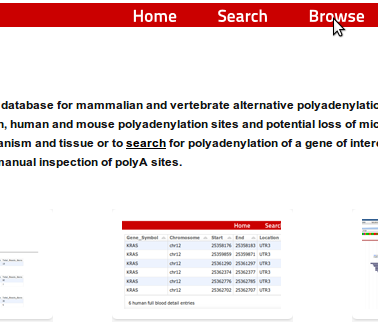 15. To browse all genes contained in APADB, the user can click on the Browse button of the start page
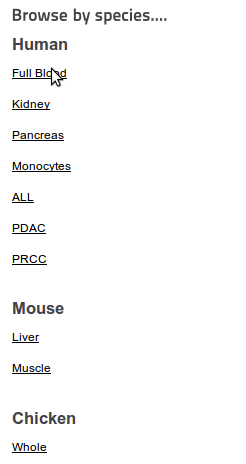 16. Afterwards, a tissue and an organism has to be selected
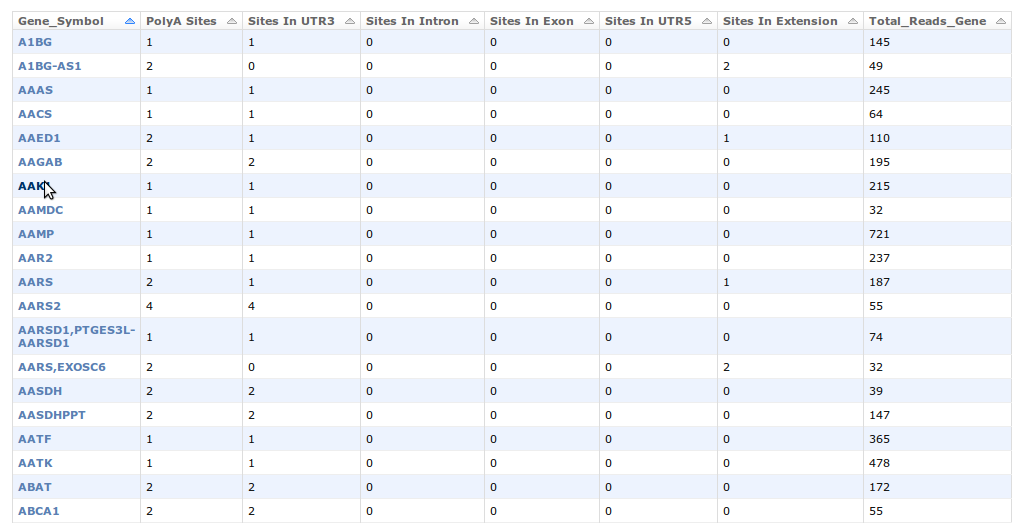
17. The list of genes for which PA sites are available can be sorted according to the number of PA sites, gene name etc. A click on the HUGO name of the gene will lead the user to a detailed view of the PA sites as described in 4.
Back to top
How to download data from the APADB website
To download the PA sites contained in APADB, the user can click on the Download button available at the start page. We provide three separate .BED files, one for each organism. These files contain the PA sites detected in pooled tissue samples. The columns in the files contain the following information for a PA site:1. Chromosome
2. PA site start
3. PA site end
4. PA site identifier: The hugo name of the corresponding gene and the number of the PA site (the site at the outermost 3' end corresponds to 1)
5. The number of supporting MACE reads
6. The mapping strand
7. The region in the gene (3'UTR, exon, intron...)
8. The median in the cluster
9. The mode in the cluster
10. The lost miRNA binding sites if the PA site ist used (if there are any)
Back to top