Exemplary Analysis
We provide an example on how to analyze the omiRas output with a set of small RNA-Sequencing (RNA-Seq) libraries available at the gene expression omnibus (GSE31667) published by Pandis et al. (Ann Rheum Dis 2012;71:1716–1723. doi:10.1136/annrheumdis-2011-200803). Pandis and colleagues aimed to identify novel micro RNA associated with human rheumatoid arthritis (RA) by performing small RNA-Seq on cells isolated from the human tumor necrosis factor (TNF) transgenic mouse model and Wild Type control mice. For each condition they sequenced two small RNA-Seq libraries.
Quality Control
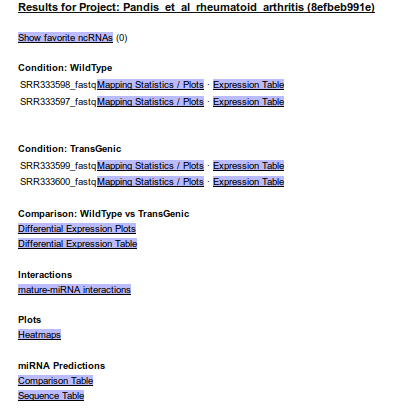
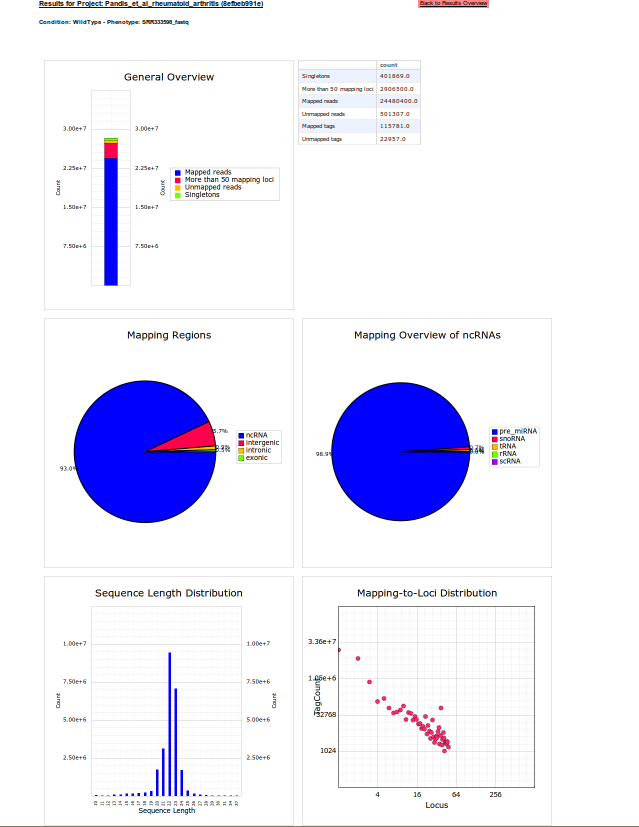
To access the quality of the sequence run in library SRR333598_fastq, the user can select Mapping statistic / Plots on the main results page. Here, sequence length distribution and genomic read distributions are displayed. The mapping results indicate, that nearly all reads were successfully mapped to the mouse genome, some of these in repeat regions indicated by more than 50 potential mapping loci. 93% of the reads were annotated to non-coding RNAs (ncRNAs), 98,9% of these comprised microRNAs (miRNAs). This is also reflected in the length distribution of reads, were a peak between 19-25 Bps indicates a high miRNA abundance. Additionally, most reads were assigned to 1-5 mapping loci, which is also typical for microRNAs, of which many have between 1-5 copies on the mouse genome.
Expression
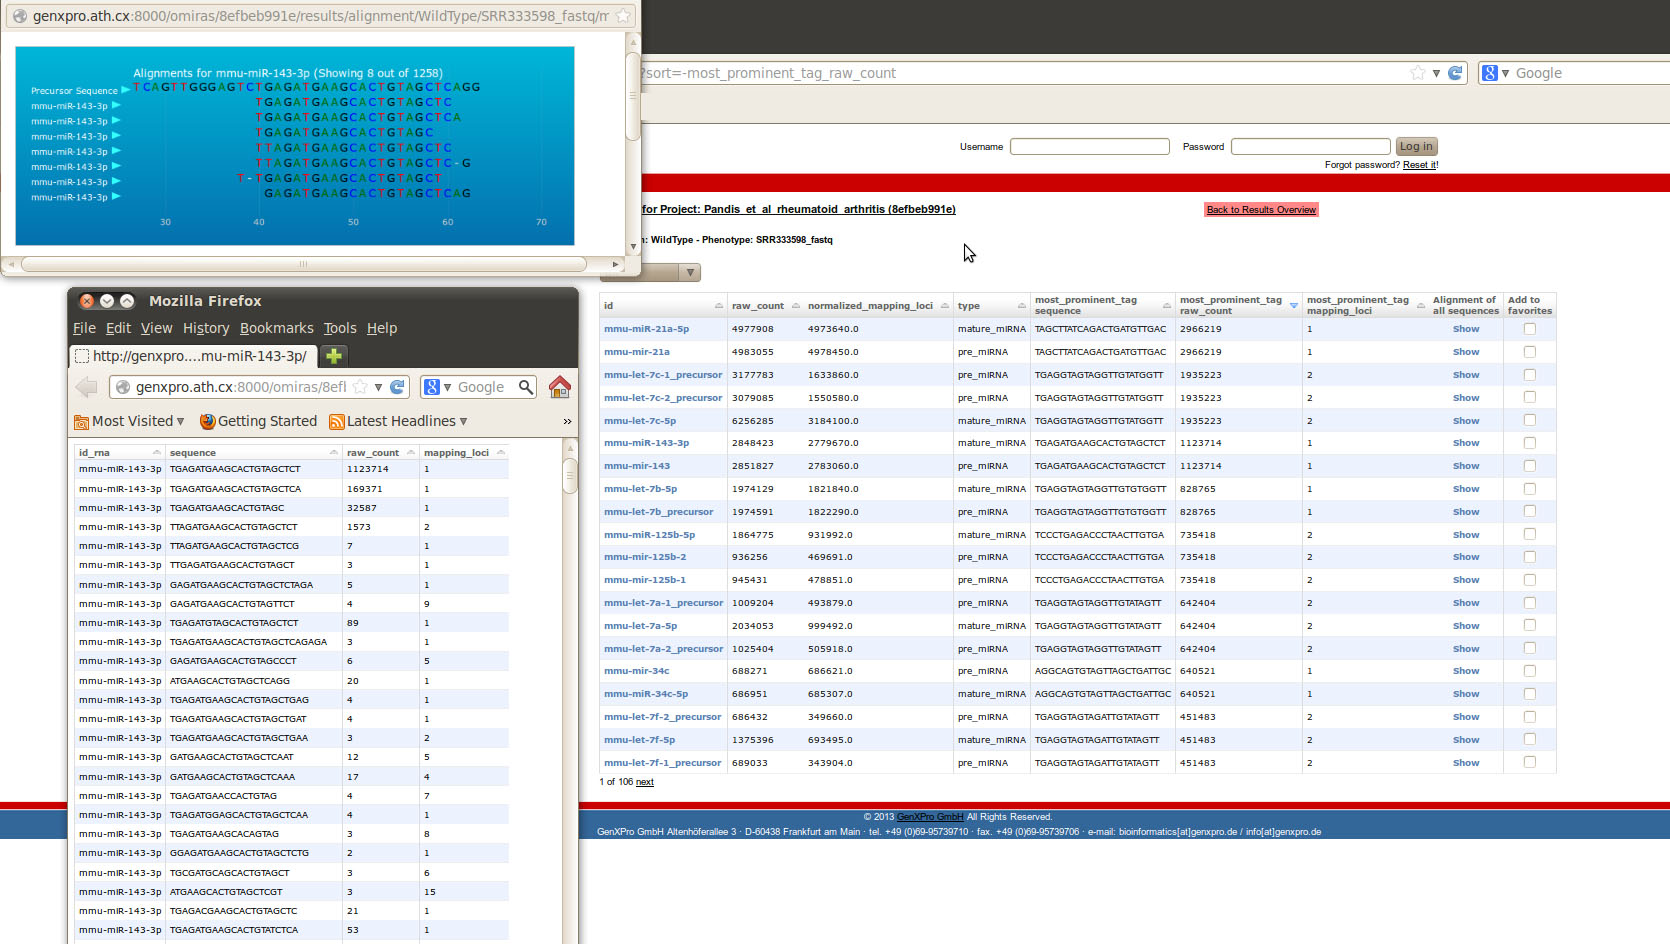
To get further information about the detailed distribution of ncRNA in the library, the Expression Table can be accessed from the main results page. For each ncRNA the identifier, the raw counts in the library, the counts normalized with the number of mapping loci, the ncRNA type, the most prominent sequence tag, its raw counts and mapping loci, as well as an alignment of tags to the precursor (only for miRNAs), is available. Additionally, all tags together with their read abundance are available for each ncRNA with a click on the identifier. E.g. for the -3p variant of miR-143 the most abundant tag TGAGATGAAGCACTGTAGCTCT has been sequenced 1,123,714 times and one exact chromosomal mapping locus could be assigned to the tag. The tag can be aligned to the precursor of miR-143 without gaps or mismatches as shown by a click on Show under Alignment of all sequences.
Differential Expression
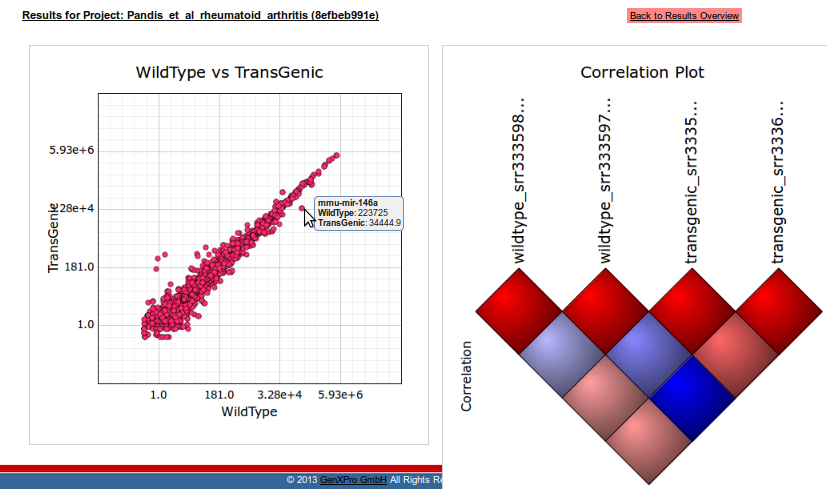
To get a first impression of the relationships between sequencing libraries, the user can select Scatter-/Correlation plots from the start site of his project. A correlation plot gives information about the Pearson correlation coefficient (PCC) between all replicates. As expected, the correlation within one condition is higher than between replicates of different conditions. A 2D scatter-plot visualizes the mean expression for each ncRNA between the two conditions. For example miR-146a is highly expressed in both conditions, nevertheless it shows a higher expression in the Wild Type. Additionally at least six more ncRNAs can be identified with a strong difference in log2 expression between the libraries.
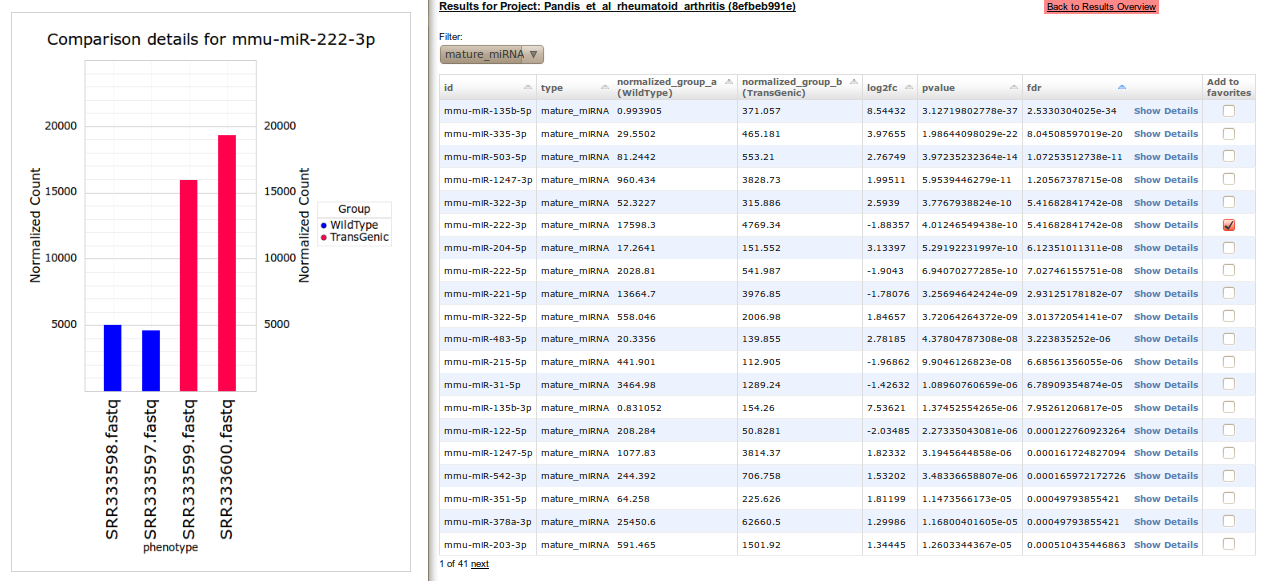
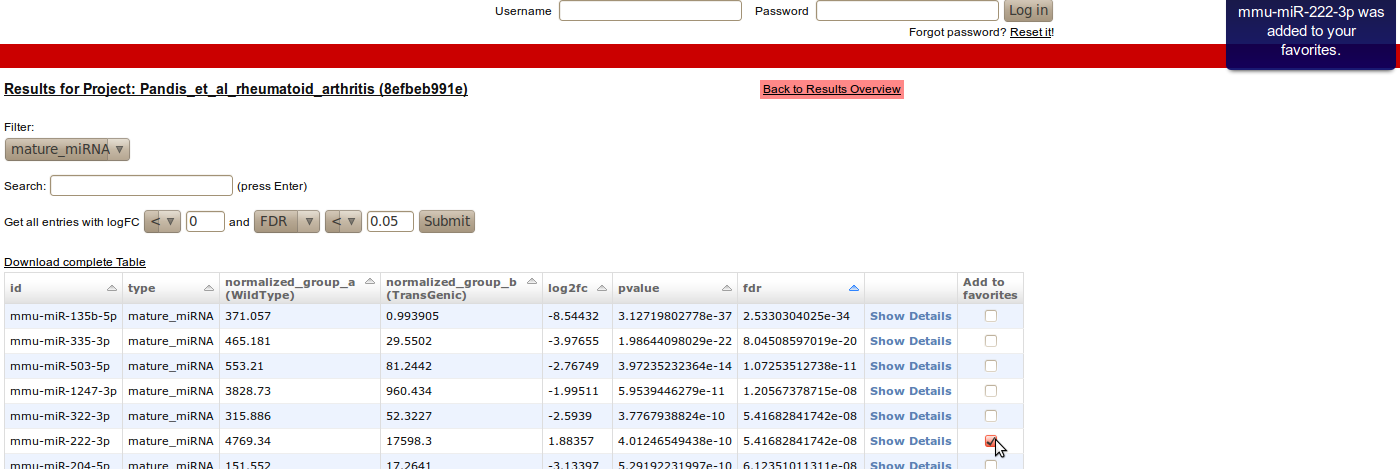
With a click on Differential expression table, pairwise comparisons for all ncRNAs are displayed. The user can choose to display only entries of a specific ncRNA class. Additionally the user can sort the table by id, type, mean expression, log2 fold-change, p-value, and FDR corrected p-value. MiRNAs of interest (due to strong differential expression) can be added to the favorites of the user by selecting the check box under Add to favorites. With these favorites the user can generate Interaction networks and Heatmaps starting from the main site of his project. Judged by FDR, miR-135b-5p shows the most significant differential expression of mature miRNAs between control and transgenic mice. The normalized expression values for each library are visualized by a click on Show Details. Overall, 47 mature miRNAs with a FDR<0.05 indicatiing differential expression could be identified.
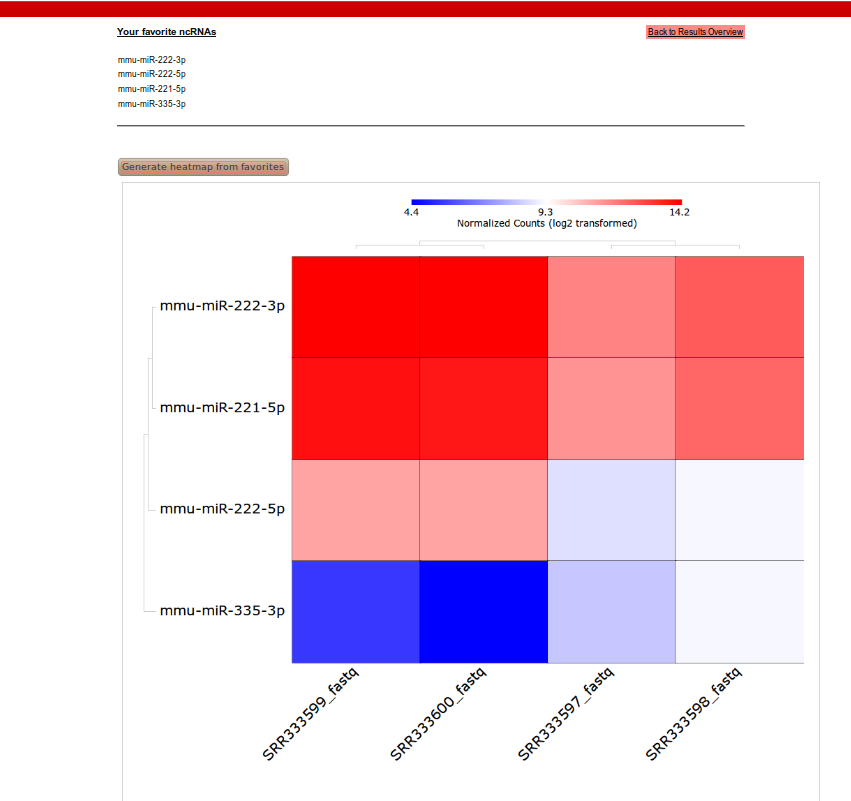 With four mature microRNAs (miR-221-3p, miR-222-3p, miR-222-5p, mir-335-3p) in the list of favorites, we generated a heatmap by selecting Heatmaps on the project page.
The heatmap is created with euclidean distance as a distance measure and an average linkage hierarchical clustering algorithm.
Novel miRNA prediction
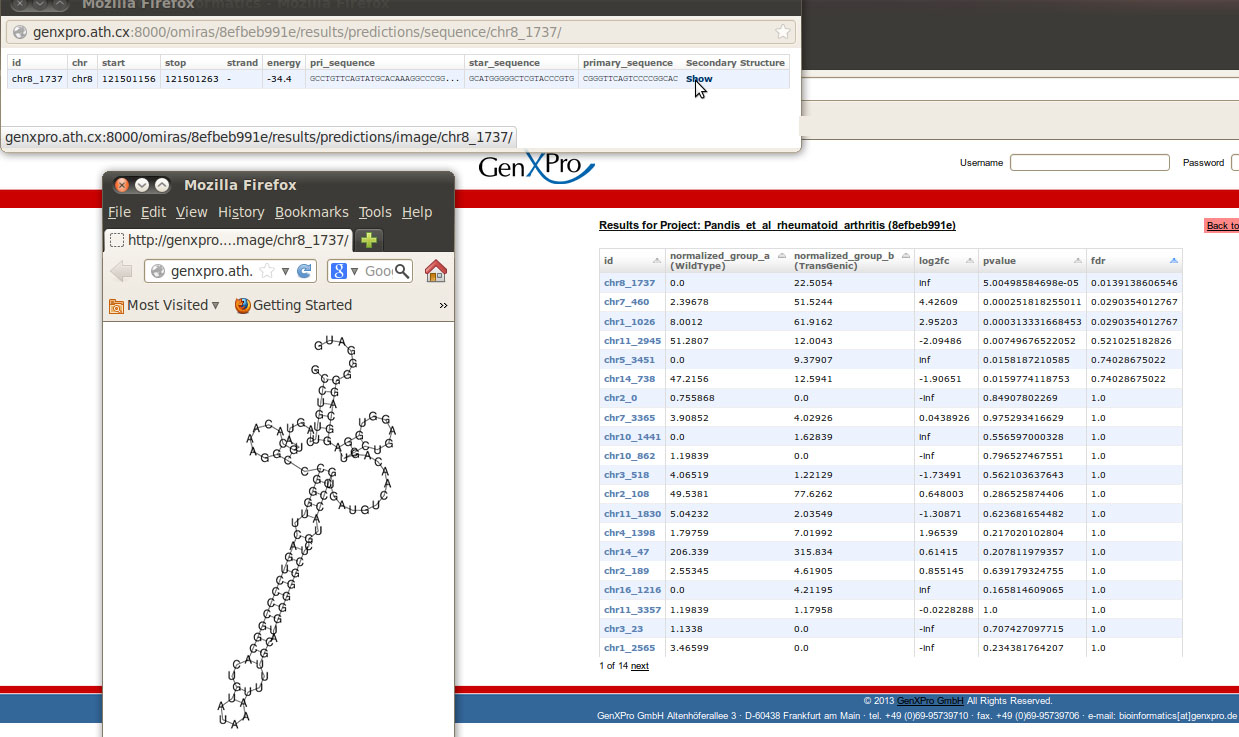
Predicted novel (not known to miRBase) microRNAs can be accessed via the Differential Expression Table under miRNA predictions. To each potential miRNA a unique identifier is assigned. Additionally the expression results for each condition are available, like in the Differential Expression table for known ncRNAs. For the dataset of Pandis et al. we found three novel miRNAs that were differentially expressed between the two conditions (FDR<0.05). For the most significantly differentially expressed miRNA the detailed information including the chromosomal location, the energy of the predicted secondary structure, the primary and the star sequence as well as a visualization of the secondary structure are displayed (accessible via a click on the id).
Interaction network
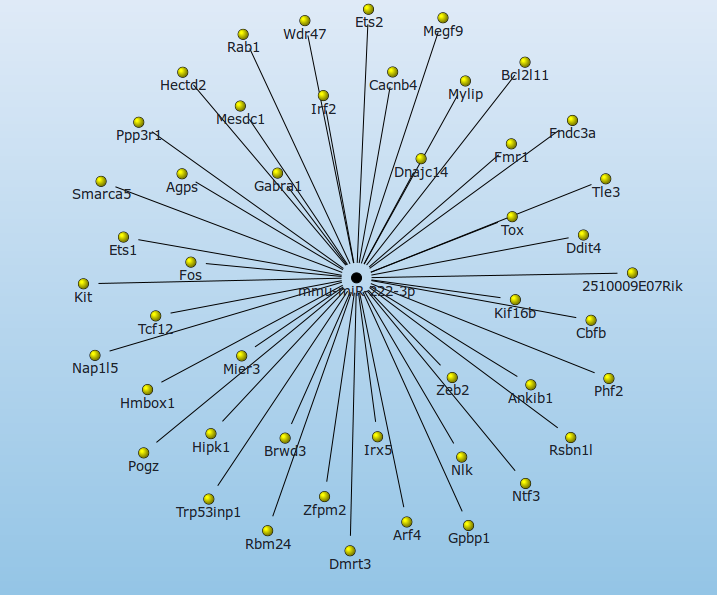
To generate an interaction network the user has to assign at least one mature miRNA to his favorites from the Differential Expression Table. The association of miR-222 with rheumatoid arthritis is one of the main findings of Pandis and colleagues, therefore it serves as an example for analysis.
After assigning miRNAs to the list of favorites, an interaction network can be generated by a click on Interaction network from mature miRNAs. Here only experimentally validated interactions between miRNAs an targets, or predicted interactions that are supported by at least x of 7 miRNA-mRNA interaction prediction tools can be shown (where x is selected by the user). In mouse the miR-222-3p has two experimentally validated targets: Cdkn1b and Kit.
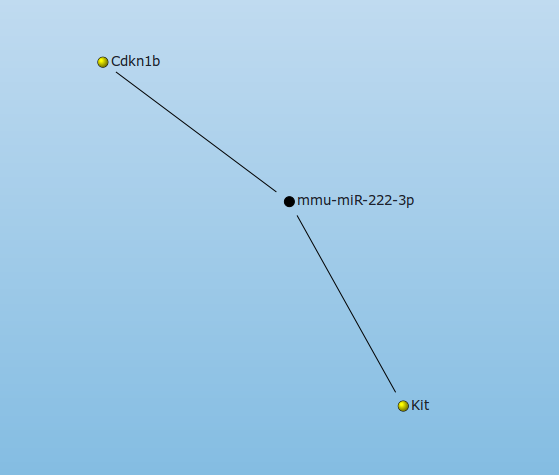
According to Pandis et al. Mir-222-3p is significantly overexpressed in RA SF. Several publications (i.e. this ) propose the downregulation of CDKN1B (often referred to as a cell cycle inhibitor protein because its major function is to stop or slow down the cell division cycle) in RA. This indicates that the downregulation of CDKN1B might be caused by the upregulation of miR-222.
The network of predicted targets that are present in 5 or more interaction databases reveals several other potential targets of miR-222 that have an implication in the development of RA, like DDIT4, c-FOS, TLE3 or ETS-1. This underlines the role of miR-222 in the development of RA and as a potential target for the therapy of RA patients.