
omiRas Workflow
omiRas is a free web service designed for the analysis of non coding RNA (ncRNA) datasets from replicated Illumina/Solexa small RNA-Sequening (RNA-Seq) experiments of two different conditions (e.g. cancer and adjacent control tissue of several patients). Starting with raw sequencing data, omiRas offers an efficent way to quantify ncRNA expression in each library, to analyze differential expression of ncRNAs, to identify novel microRNAs (miRNAs) and to interactively assign functions to differentially expressed miRNAs. The combination of miRNA-mRNA interaction databases together with protein-protein interaction information allows the user to construct interaction networks of interesting miRNAs and mRNAs and to identify microRNAs with important implications in the development of differential gene signatures.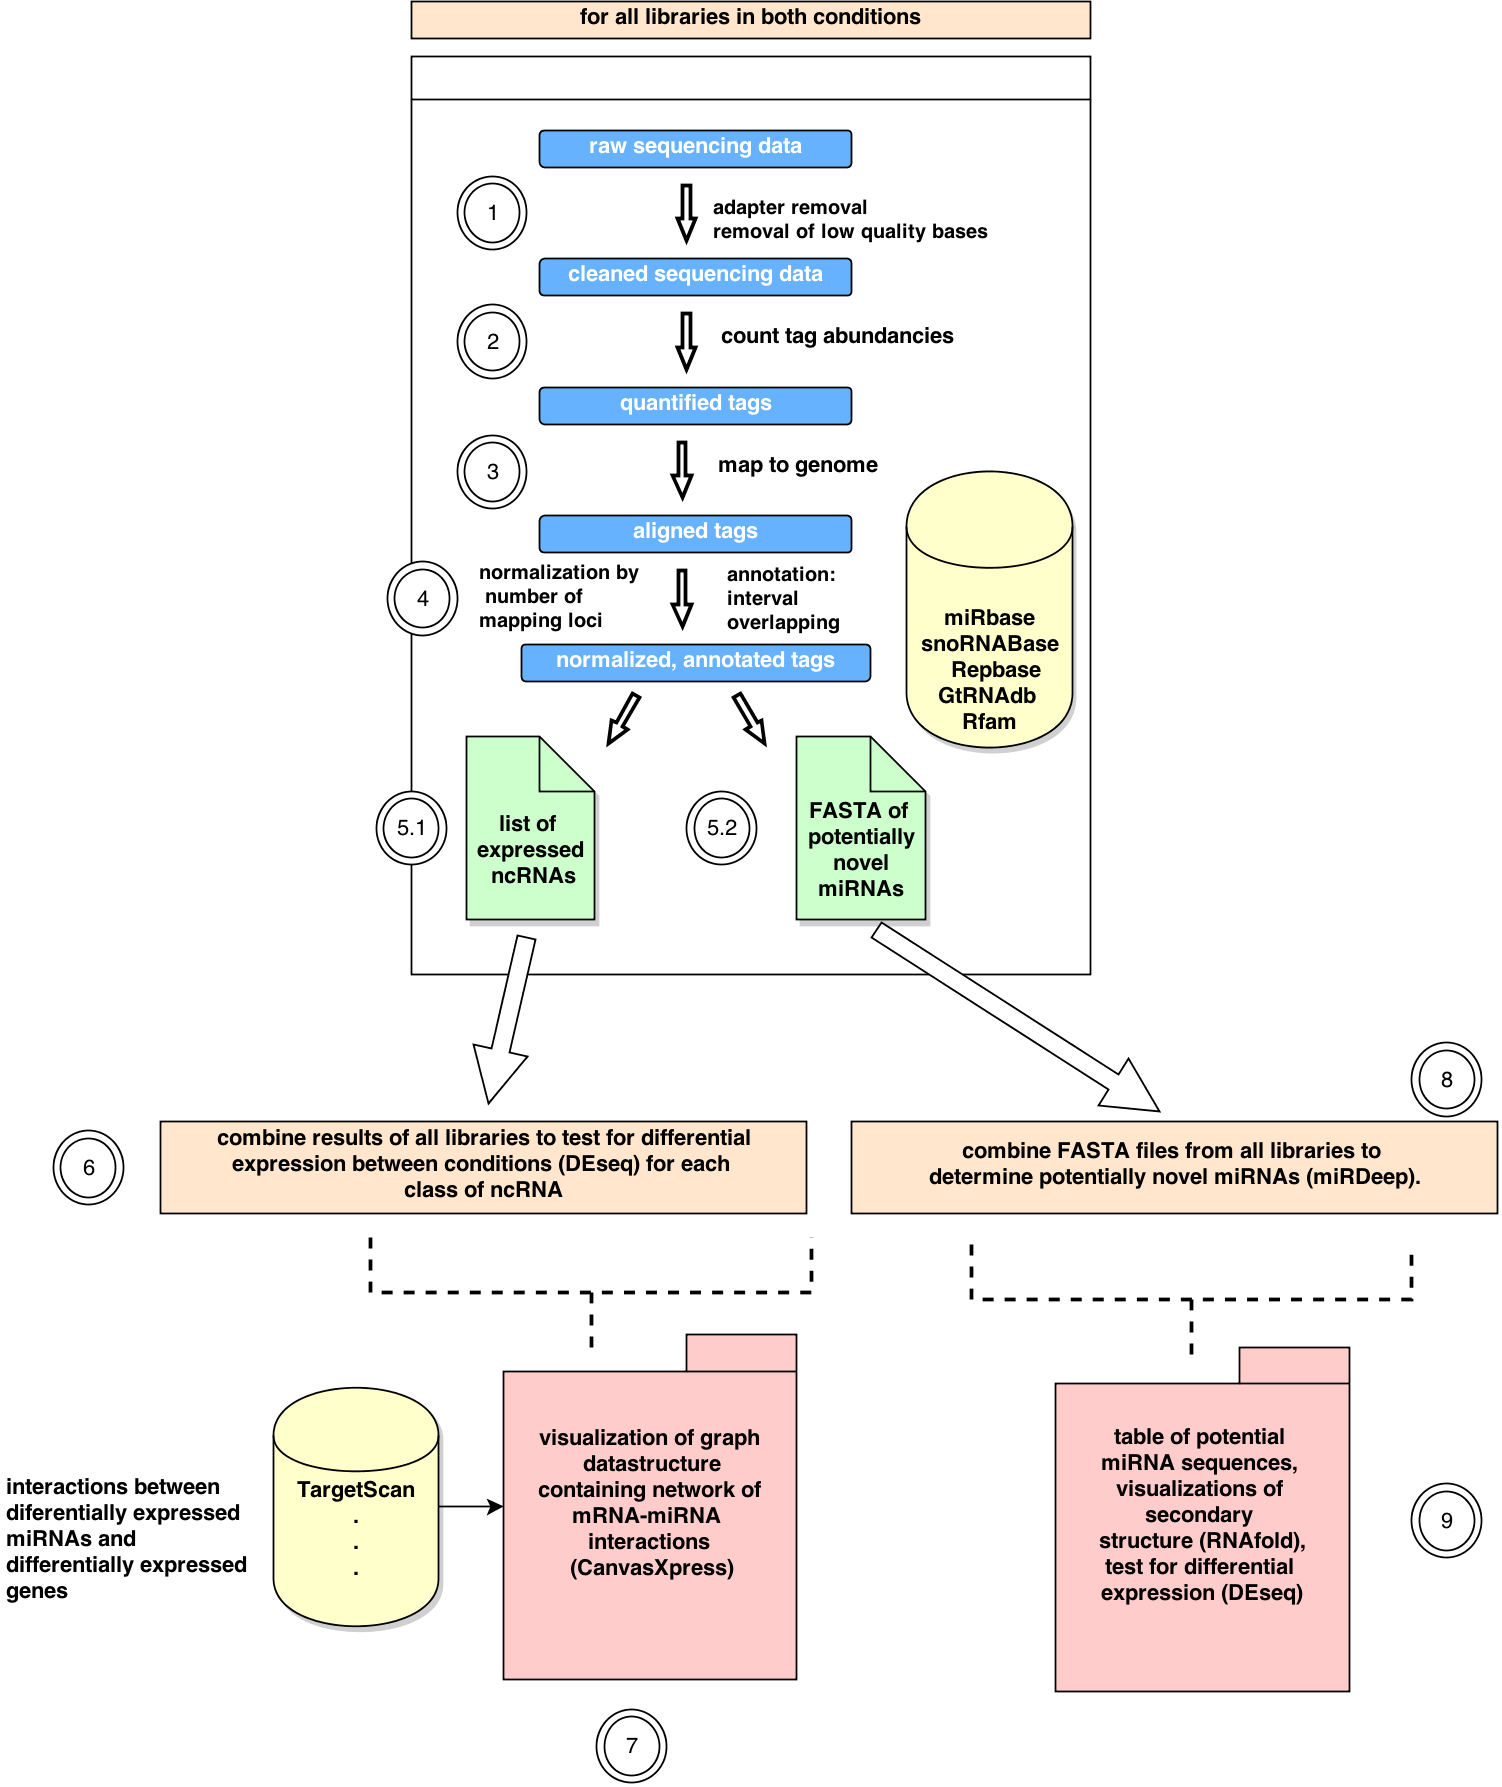
Overview
In steps (1-5) the read (pre-)processing and ncRNA quantification is performed for each library independently. These independent results are combined and used for differential expression analysis (6), interactive network analysis (7) and prediction of novel miRNAs (8+9).(1) Raw Data pre-processing
From the reads contained in the FASTQ files the 3' sequencing adapter is removed by a local alignment of the adapter to the sequenced reads. Furthermore Illumina's marked quality region is trimmed.(2) TAG quantification
The reads in each library are summarized to tags in a quantified FASTA format, e.g.>tag1_49862
GAGGTAGTAGGTTGTA
if the sequence GAGGTAGTAGGTTGTA occurs 49862 times within the FASTQ library.
(3) Mapping
The FASTA reads are mapped to the genome of the organism under consideration with bowtie,reporting only mappings in the best alignment stratum (if a read has multiple mapping loci,
only the loci with the fewest alignment mismatches are reported) allowing a maximum of two mismatches.
(4) Annotation and Normalization
For each mapping locus annotations are derived from several ncRNA databases. To take into account multiple mappings, the number of reads for each tag is normalized with the number of its mapping loci.(5) Quantification results
(5.1) The quantification results are summarized in a table together with statistics about the mapping and the sequence length distribution.(5.2) A FASTA file of tags overlapping intronic regions of coding genes or intergenic regions is created for the prediction of potentially novel microRNAs.